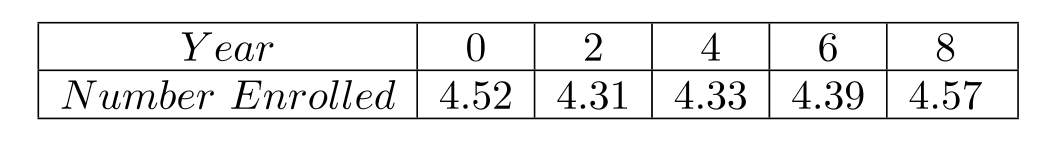
The employment rate in a city has been documented at two year intervals. The table shows the number of employed citizens, in millions, tor several years, with 2000 represented by year 0,2002 by year 2 , and so on. Use the data points , and to find a quadratic function defined by that models the data. Graph together with the data.
Correct Answer:
Verified
Q27: Perform the following matrix operations if
Q28: Suppose that
Q29: Evaluate each determinant.
(a)
Q30: Solve the system by using Cramer's
Q31: Consider the system of equations
Q33: The solution set of a system
Q34: A restaurant supply company must ship
Q35: Find the partial fraction decomposition for
Q36: Find the partial fraction decomposition for
Q37: Consider the system of equations
Unlock this Answer For Free Now!
View this answer and more for free by performing one of the following actions

Scan the QR code to install the App and get 2 free unlocks

Unlock quizzes for free by uploading documents