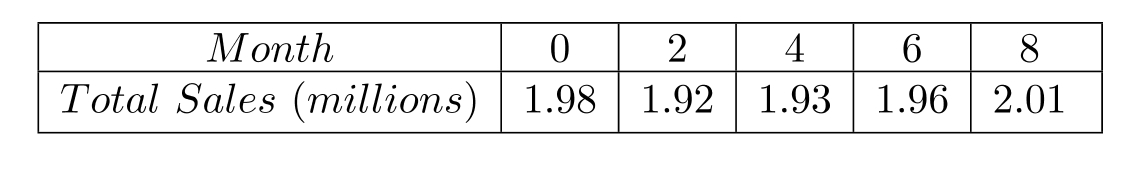
During one period, the average price of a gallon of gasoline in a town changed from day to day. The table shows the average price, in dollars, for each of several consecutive days, where 0 represents Sunday, 1 represents Monday, and so on. Use the data points , and to find a quadratic function defined by that models the data. Graph together with the data.
Correct Answer:
Verified
Q38: Solve the following system using one
Q39: Perform the following matrix operations if
Q40: Suppose that
Q41: Evaluate each determinant.
(a)
Q42: Solve the system by using Cramer's
Q43: Consider the system of equations
Q45: The solution set of a system
Q46: A restaurant supply company must ship
Q47: Find the partial fraction decomposition for
Q48: Find the partial fraction decomposition for
Unlock this Answer For Free Now!
View this answer and more for free by performing one of the following actions

Scan the QR code to install the App and get 2 free unlocks

Unlock quizzes for free by uploading documents