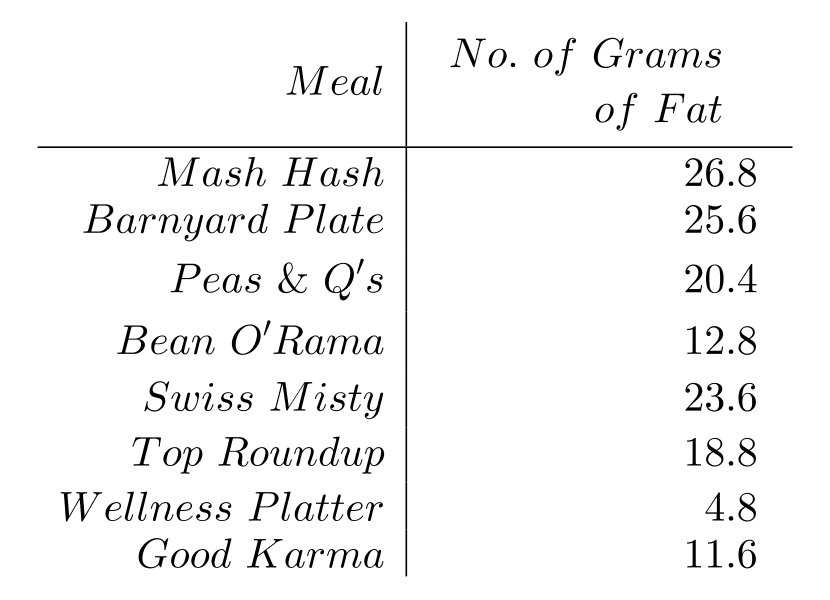
Construct a bar graph to represent the given data.
-The following table shows the average number of grams of fat in various kinds of entrees served at Karma Kitchen.
Correct Answer:
Verified
View Answer
Unlock this answer now
Get Access to more Verified Answers free of charge
Q48: Refer to the double-bar graph below which
Q49: Construct a bar graph to represent the
Q50: Construct a bar graph to represent the
Q51: Construct a bar graph to represent
Q52: Construct a bar graph to represent
Q54: Use the graph to answer the question.
Q55: Use the graph to answer the question.
Q56: Use the graph to answer the
Q57: Use the graph to answer the
Q58: Use the graph to answer the
Unlock this Answer For Free Now!
View this answer and more for free by performing one of the following actions

Scan the QR code to install the App and get 2 free unlocks

Unlock quizzes for free by uploading documents