Multiple Choice
Solve the problem.
-Data regarding the amount spent by a government department is represented in the following graph. Find the rate of change of the amount spent with respect to time, in billions per year.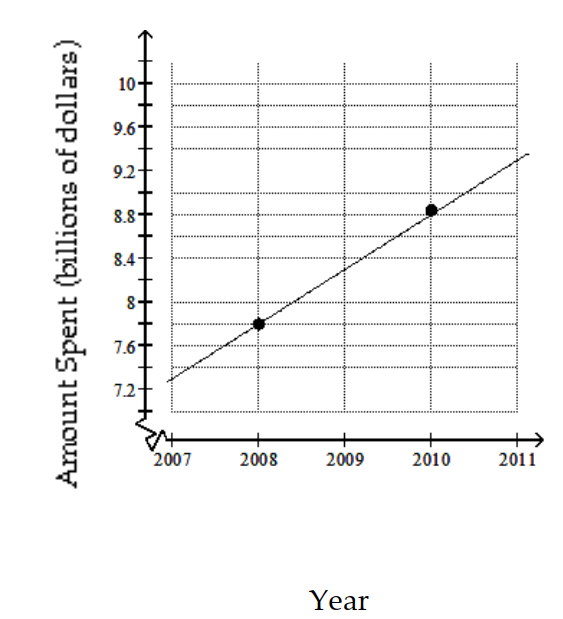
A) Increase of billion per year
B) Decrease of billion per year
C) Decrease of billion per year
D) Increase of billion per year
Correct Answer:
Verified
Related Questions
Q105: Find the slope of the line.
-
Q106: Solve the problem.
-Kannanaski Rapids drops
Q107: Solve the problem.
-Over one particular stretch
Unlock this Answer For Free Now!
View this answer and more for free by performing one of the following actions

Scan the QR code to install the App and get 2 free unlocks

Unlock quizzes for free by uploading documents