Use this graph to answer the question.
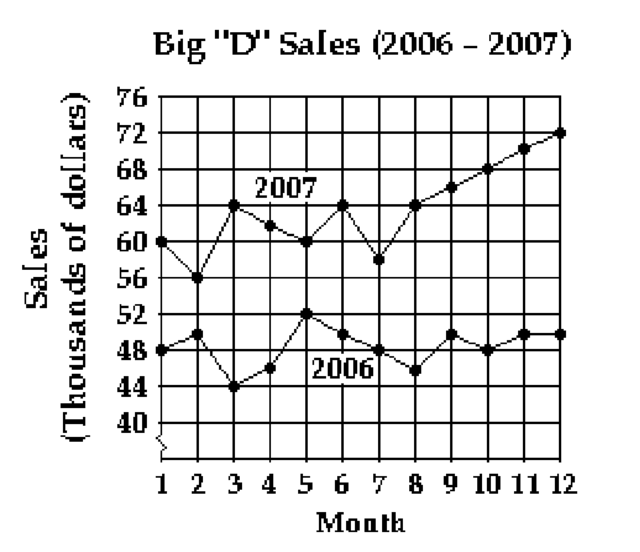
-What was the percent of increase in sales between month 2 and month 12 of 2007 ? Round your answer to the nearest tenth.
A)
B)
C)
D)
Correct Answer:
Verified
Q90: Use this graph to answer the
Q91: Use this graph to answer the
Q92: Use this graph to answer the
Q93: Use this graph to answer the
Q94: Use this graph to answer the
Q96: Provide the appropriate response.
-
Q97: Provide the appropriate response.
-A street has
Q98: Provide the appropriate response.
-Suppose that you
Q99: Provide the appropriate response.
-Consider the following table,
Q100: Provide the appropriate response.
-In a recent city
Unlock this Answer For Free Now!
View this answer and more for free by performing one of the following actions

Scan the QR code to install the App and get 2 free unlocks

Unlock quizzes for free by uploading documents