The graph shows sales in thousands of dollars for 1989 and 1990. Use it to answer the question
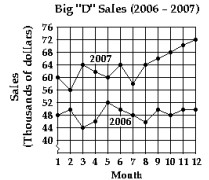
-What month in 2006 had the highest sales?
A) Month 2
B) Month 12
C) Month 3
D) Month 5
Correct Answer:
Verified
Q2: The graph shows sales in thousands
Q3: The graph shows sales in thousands
Q4: The graph shows sales in thousands
Q5: The graph shows sales in thousands of
Q6: The graph shows sales in thousands of
Q8: The graph shows sales in thousands of
Q9: Name the quadrant, if any, in
Q10: Name the quadrant, if any, in
Q11: Name the quadrant, if any, in
Q12: Name the quadrant, if any, in
Unlock this Answer For Free Now!
View this answer and more for free by performing one of the following actions

Scan the QR code to install the App and get 2 free unlocks

Unlock quizzes for free by uploading documents