Solve the problem.
-The information in the chart gives the salary of a person for the stated years. Use the information for the years 2001 and 2003 to find an equation that models the data. Let represent 2001, represent 2003, and y represent the salary. Write the equation in slope-intercept form. Use this equation to approximate the salary for 2004 to the nearest dollar.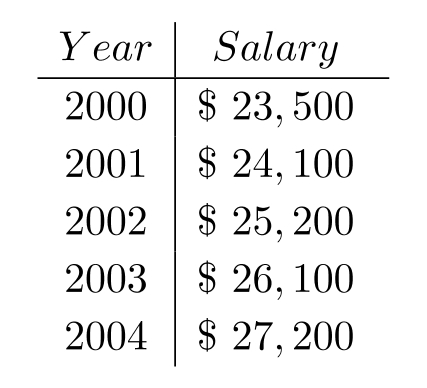
A)
B)
C)
D)
Correct Answer:
Verified
Q333: Find an equation of the line,
Q334: Find an equation of the line,
Q335: Find an equation of the line,
Q336: Find an equation of the line,
Q337: Which one of the following has
Q339: Graph the inequality or compound inequality.
-
Q340: Graph the inequality or compound inequality.
-
Q341: Which one of the following is the
Q342: Which one of the following does
Q343: Give the domain and range of
Unlock this Answer For Free Now!
View this answer and more for free by performing one of the following actions

Scan the QR code to install the App and get 2 free unlocks

Unlock quizzes for free by uploading documents