The table shown was generated by a graphing calculator. The functions defined by and y2 are linear. Based on the table, find the coordinates of the point of intersection of the graphs.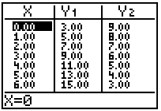
A)
B)
C)
D)
Correct Answer:
Verified
Q39: Tell how many solutions the system
Q40: Tell how many solutions the system
Q41: Tell how many solutions the system
Q42: Tell how many solutions the system
Q43: Tell how many solutions the system
Q45: The table shown was generated by
Q46: The table shown was generated by
Q47: The table shown was generated by
Q48: The solution set of the system
Q49: The solution set of the system
Unlock this Answer For Free Now!
View this answer and more for free by performing one of the following actions

Scan the QR code to install the App and get 2 free unlocks

Unlock quizzes for free by uploading documents