The graphs below represent the supply and demand for a product at various prices per unit. Approximately how many units should be produced so that supply equals demand?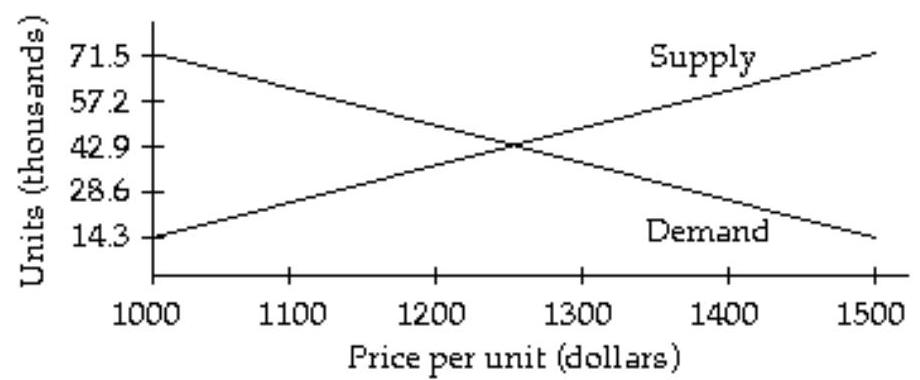
A) 2250 units
B) 42,900 units
C) 2255 units
D) 42.9 units
Correct Answer:
Verified
Q50: Which of the ordered pairs listed
Q51: Which of the ordered pairs is
Q52: Betsy doesn't trust banks, so her
Q53: Emilia doesn't trust banks, so her savings
Q54: The graphs below represent the supply
Q56: A company manufactures three products. The
Q57: A company manufactures three products. The
Q58: After retirement, Kelly's company offers her
Q59: After retirement, Kelly's company offers her
Q60: Solve the system of equations.
-
Unlock this Answer For Free Now!
View this answer and more for free by performing one of the following actions

Scan the QR code to install the App and get 2 free unlocks

Unlock quizzes for free by uploading documents