The graphs show the sales of two companies competing for market share.
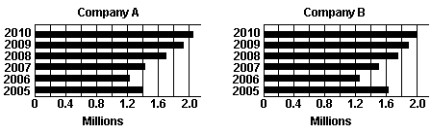
-If represents Company B's sales in 2007 and represents Company A's sales in the same year, then the relationship between and is
A)
B)
C)
Correct Answer:
Verified
Q214: The graphs show the sales of
Q215: The graphs show the sales of
Q216: The graphs show the sales of
Q217: The graphs show the sales of
Q218: The graphs show the sales of
Q220: Explain why the statement
Q221: A student claims that
Q222: A student claims that
Q223: Add or subtract as indicated.
-
Q224: Add or subtract as indicated.
-
Unlock this Answer For Free Now!
View this answer and more for free by performing one of the following actions

Scan the QR code to install the App and get 2 free unlocks

Unlock quizzes for free by uploading documents