The following scatterplot shows the relationship between the left and right forearm lengths (cm) for 55 college students along with the regression line, where y = left forearm length x = right forearm length. (Source: physical dataset on the CD.) 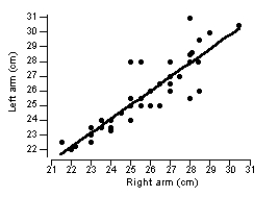 Which is the appropriate equation for the regression line in the plot?
A) = 1.22 + 0.95x
B) = 1.22 -0.95x
C) = 1.22 + 0.95y
D) = 1.22 - 0.95y
Correct Answer:
Verified
Q26: Use the following information for questions:
Q27: Use the following information for questions:
Q28: Use the following information for questions:
Q29: Use the following information for questions:
Q30: Use the following information for questions:
Q32: Use the following information for questions:
A
Q33: Use the following information for questions:
A
Q34: Use the following information for questions:
A
Q35: For which one of these relationships could
Q36: The regression line for a set
Unlock this Answer For Free Now!
View this answer and more for free by performing one of the following actions

Scan the QR code to install the App and get 2 free unlocks

Unlock quizzes for free by uploading documents