Use the following information for questions:
The following histogram gives the distribution of the difference between the actual and ideal weights for a sample of male college students. Ideal weights are responses to the question "What is your ideal weight"? The difference = actual -ideal. 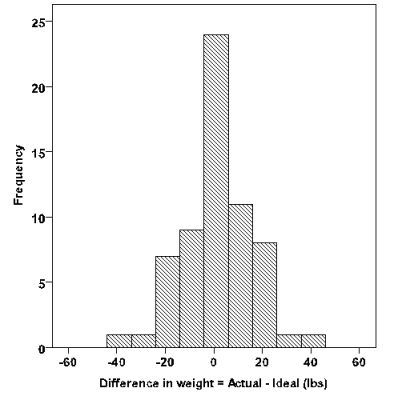
-What is the approximate shape of the distribution?
A) Nearly symmetric.
B) Skewed to the left.
C) Skewed to the right.
D) Bimodal (has more than one peak) .
Correct Answer:
Verified
Q27: Use the following information for questions:
The
Q28: Use the following information for questions:
The
Q29: Use the following information for questions:
The
Q30: Use the following information for questions:
The
Q31: Use the following information for questions:
The
Q33: Use the following information for questions:
The following
Q34: Use the following information for questions:
The following
Q35: The following boxplot is for the results
Q36: Which of the following provides the most
Q37: Use the following information for questions:
According
Unlock this Answer For Free Now!
View this answer and more for free by performing one of the following actions

Scan the QR code to install the App and get 2 free unlocks

Unlock quizzes for free by uploading documents