Short Answer
Table 18.2
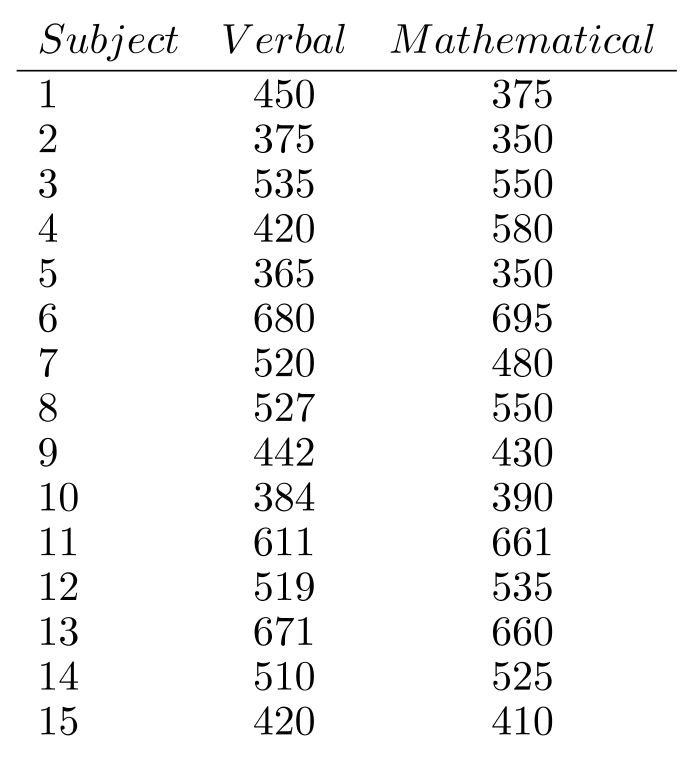
-Table 18.2 shows the scores made on the verbal and mathematical components of an S.A.T. by 15 high -school seniors who plan to go to a certain college. Use the table to calculate the Spearman Rank-Correlation Coefficient for the test scores.
Correct Answer:
Verified
Related Questions
Q14: Students were observed as they arrived
Q15: A test was conducted to compare
Q16: Random samples of 15 Model I
Q17: An aptitude test is given to
Unlock this Answer For Free Now!
View this answer and more for free by performing one of the following actions

Scan the QR code to install the App and get 2 free unlocks

Unlock quizzes for free by uploading documents