Use the graph to solve the problem.
-In one city, the temperature in Fahrenheit on a typical summer day can be approximated by the following function:
Here, represents the number of hours since 6 a.m. The graph of this function is shown below. At what time does it start to get cooler?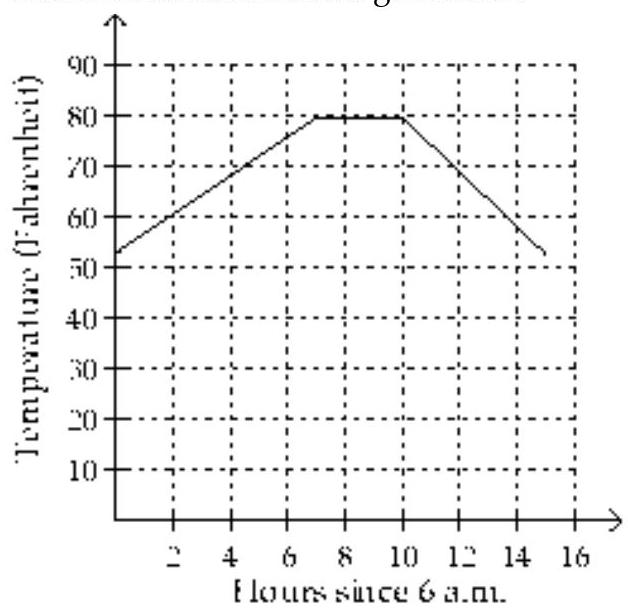
A) At 10 a.m.
B) At 4 p.m.
C) At 1 p.m.
D) At 3 p.m.
Correct Answer:
Verified
Q99: Use the vertical line test to determine
Q100: Use the graph to solve the
Q101: Use the graph to solve the
Q102: Use the graph to solve the
Q103: Use the graph to solve the
Q105: Solve the problem.
-Find
Q106: Solve the problem.
-Find
Q107: Solve the problem.
-Find
Q108: Solve the problem.
-In one city, the
Q109: Solve the problem.
-The population of one
Unlock this Answer For Free Now!
View this answer and more for free by performing one of the following actions

Scan the QR code to install the App and get 2 free unlocks

Unlock quizzes for free by uploading documents