Solve the problem.
-The following table shows the number (in thousands) of albums and t-shirts sold for three different months in the same year.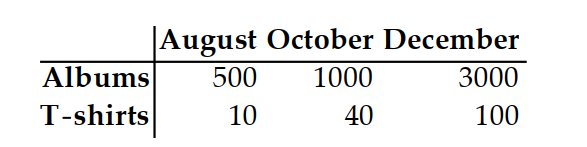
Model the number of -shirts sold as a function of the album sales and time using a linear function of the form constants) where represents thousands of -shirts sold to date, a represents thousands of albums sold to date, and represents time in months since April of that year.
A)
B)
C)
D)
Correct Answer:
Verified
Q18: Graph the level curves in the
Q19: Graph the level curves in the
Q20: Graph the level curves in the
Q21: Graph the level curves in the
Q22: Graph the level curves in the
Q24: Solve the problem.
-Production of television sets
Q25: Solve the problem.
-The number of cows
Q26: Solve the problem.
-The surface area of
Q27: Choose the graph of the equation.
-
Q28: Choose the graph of the equation.
-
Unlock this Answer For Free Now!
View this answer and more for free by performing one of the following actions

Scan the QR code to install the App and get 2 free unlocks

Unlock quizzes for free by uploading documents