Use the following
A dotplot and the summary statistics for a sample are provided. In each case, indicate whether or not it is appropriate to use the t-distribution.
-n = 12;  = 4.75; s = 1.603
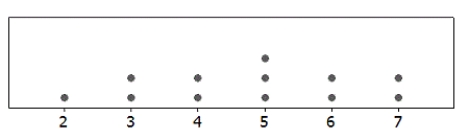
A) Appropriate
B) Not Appropriate
Correct Answer:
Verified
Q48: Use the following
For each of the
Q49: Use the following
For each of the
Q50: Use the following
For each of the
Q51: Use the following
For each of the
Q52: Use the following
For each of the
Q54: Use the following
A dotplot and the summary
Q55: Use the following
A dotplot and the summary
Q56: Use the following
A dotplot and the summary
Q57: Use the following
November 6, 2012 was election
Q58: Use the following
November 6, 2012 was election
Unlock this Answer For Free Now!
View this answer and more for free by performing one of the following actions

Scan the QR code to install the App and get 2 free unlocks

Unlock quizzes for free by uploading documents