The following table is associated with the average number of patients served,
0ver 6 days, at different months of the year.
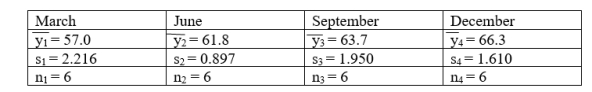
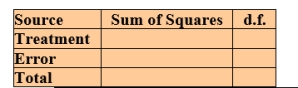
 Present the ANOVA table for these data.
Correct Answer:
Verified
Q1: Consider the following data: Q2: Use the relations for sums of squares Q3: Perfect scores are not always attained in Q5: Using the table of percentage points for Q6: Consider the following ANOVA table. Q7: Consider the following ANOVA table. Q8: There are four lecture sessions for a Q9: Taking Q10: Four drug stores have a pharmacy which Q11: Consider the following data:
![]()

![]()
Unlock this Answer For Free Now!
View this answer and more for free by performing one of the following actions

Scan the QR code to install the App and get 2 free unlocks

Unlock quizzes for free by uploading documents