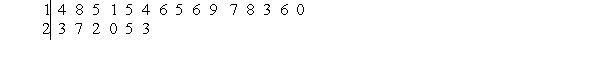
Use the stem-and-leaf display to construct a frequency distribution with intervals 10-12, 13-15, ..., 25-27.
Correct Answer:
Verified
Q10: The following table shows the countries whose
Q11: Find the histogram that better describes the
Q12: The top number of goals scored by
Q13: The number of touchdowns of a college
Q14: The following data represents the Tampa Buccaneers
Q16: The table below shows the fastest race
Q17: Calculate the mean and median of the
Q18: Calculate the mean and median of the
Q19: Calculate the mean and the median of
Q20: In a period of twelve years,
Unlock this Answer For Free Now!
View this answer and more for free by performing one of the following actions

Scan the QR code to install the App and get 2 free unlocks

Unlock quizzes for free by uploading documents