
Figure 4.12
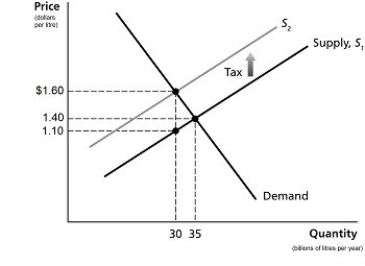
-Refer to Figure 4.12.The figure above represents demand and supply in the market for gasoline.Use the diagram to answer the following questions.
a.How much is the government tax on each litre of gasoline?
b.What portion of the unit tax is paid by consumers?
c.What portion of the unit tax is paid by producers?
d.What is the quantity sold after the imposition of the tax?
e.What is the after-tax revenue per litre received by producers?
f.What is the total tax revenue collected by the government?
g.What is the value of the excess burden of the tax?
h.Is this gasoline tax efficient?
Correct Answer:
Verified
b.Consumer burde...
View Answer
Unlock this answer now
Get Access to more Verified Answers free of charge
Q148: The actual division of the burden of
Q169: Figure 4-9 Q175: The division of the burden of a Q178: Figure 4-8 Q179: When the government taxes a good or Q181: Using a supply and demand graph, illustrate Q186: What is "tax incidence"? What determines tax Q187: Figure 4-11 Q187: If the demand curve for a product Q189: One result of a tax is an Unlock this Answer For Free Now! View this answer and more for free by performing one of the following actions Scan the QR code to install the App and get 2 free unlocks Unlock quizzes for free by uploading documents
![]()
![]()
![]()

