
Figure 15.4
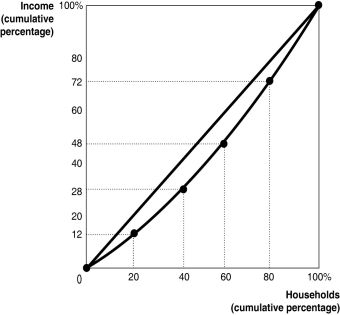
Figure 15.4 shows the Lorenz curve for a hypothetical country.
-Refer to Figure 15.4.The middle 20 percent of households
A) earn 20 percent of the society's total income.
B) earn 36 percent of the society's total income.
C) earn 48 percent of the society's total income.
D) earn 50 percent of the society's total income.
Correct Answer:
Verified
Q104: Between 1976 and 2010, income inequality in
Q107: What is the low income cut-off?
A)It is
Q110: Suppose in an effort to raise tax
Q111: Between 1976 and 2010, income inequality in
Q112: What is the poverty rate?
A)the rate at
Q184: For a given supply curve, the deadweight
Q185: Explain the effect of price elasticities of
Q211: As the value of the Gini coefficient
Q216: A statistical tool used to measure inequality
Q217: Figure 18-4
![]()
Unlock this Answer For Free Now!
View this answer and more for free by performing one of the following actions

Scan the QR code to install the App and get 2 free unlocks

Unlock quizzes for free by uploading documents