
Figure 18-11
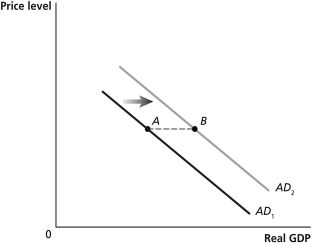
-Refer to Figure 18-11.If government purchases increase by $100 billion and lead to an ultimate increase in aggregate demand as shown in the graph below,the difference in real GDP between point A and point B will be
A) $100 billion.
B) less than $100 billion.
C) more than $100 billion.
D) There is insufficient information given here to draw a conclusion.
Correct Answer:
Verified
Q102: What are the key differences between how
Q104: To complement actions by the Fed to
Q114: Which of the following would be most
Q117: Figure 18-10 Q119: Table 18-2 Q121: If the tax multiplier is -1.5 and Q125: Economists refer to the series of induced Unlock this Answer For Free Now! View this answer and more for free by performing one of the following actions Scan the QR code to install the App and get 2 free unlocks Unlock quizzes for free by uploading documents
![]()

