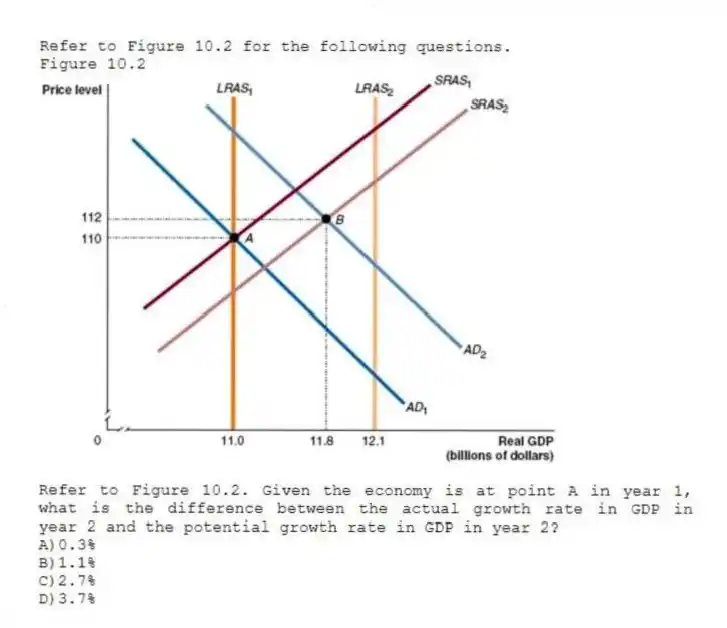
Refer to Figure 10.2 for the following questions.
Figure 10.2
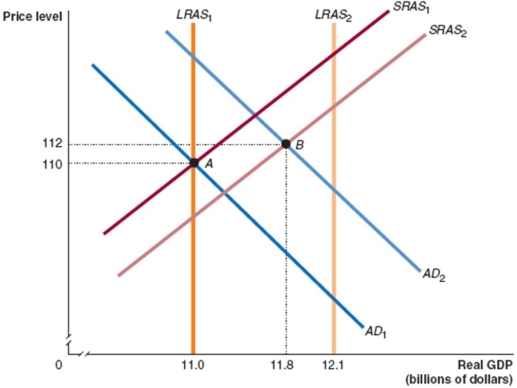
-Refer to Figure 10.2. Given the economy is at point A in year 1, what is the difference between the actual growth rate in GDP in year 2 and the potential growth rate in GDP in year 2?
A) 0.3%
B) 1.1%
C) 2.7%
D) 3.7%
Correct Answer:
Verified
Q105: 'Monetarism' is a school of thought put
Q106: According to Karl Marx (1867), which of
Q107: In the dynamic aggregate demand and aggregate
Q108: Refer to Figure 10.2 for the following
Q109: According to the real business cycle model,
Q111: The dynamic aggregate demand and aggregate supply
Q112: Which of the following models has as
Q113: The model that relies on emphasising the
Q114: In the dynamic aggregate demand and aggregate
Q115: Refer to Figure 10.2 for the following
Unlock this Answer For Free Now!
View this answer and more for free by performing one of the following actions

Scan the QR code to install the App and get 2 free unlocks

Unlock quizzes for free by uploading documents