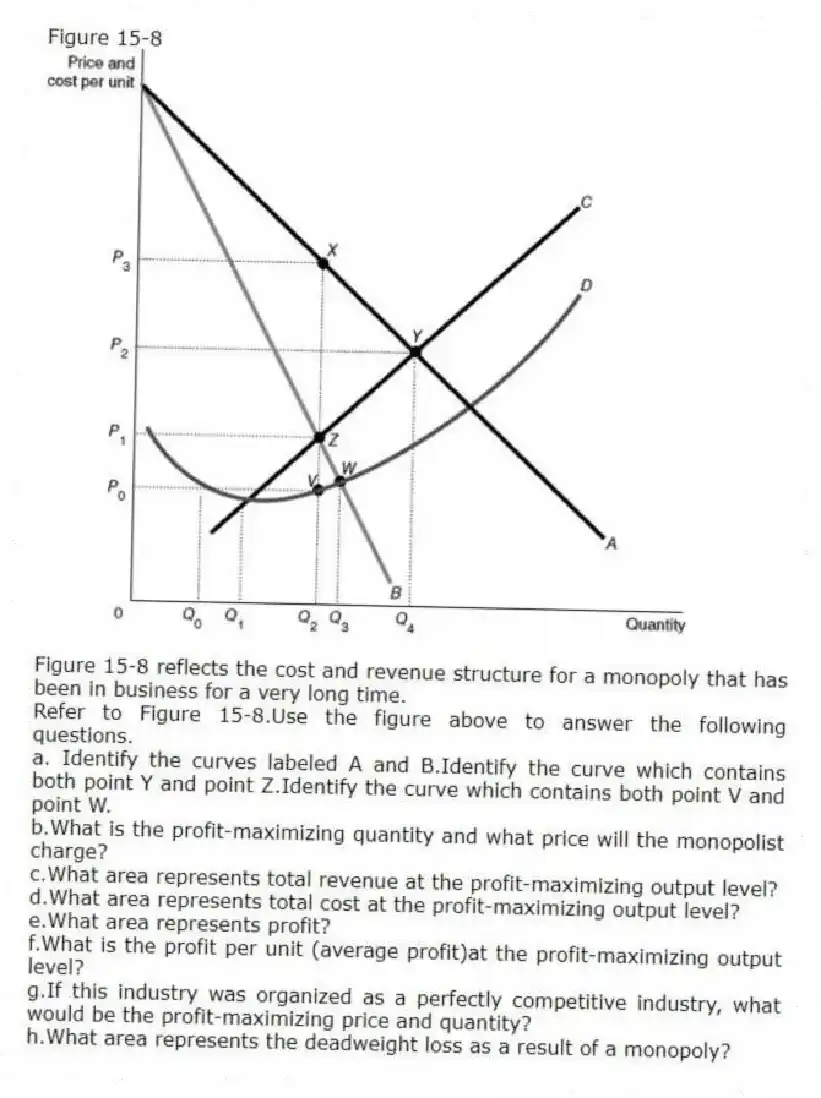
Figure 15-8
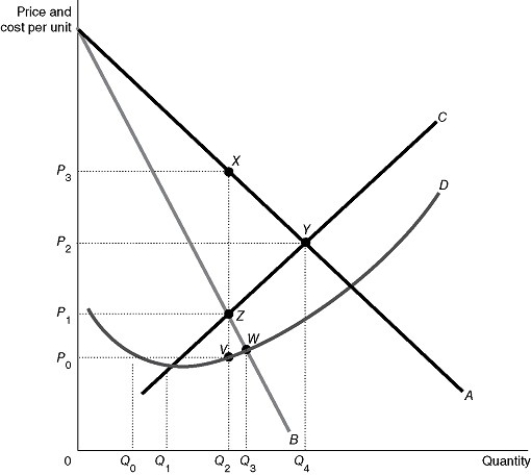
Figure 15-8 reflects the cost and revenue structure for a monopoly that has been in business for a very long time.
-Refer to Figure 15-8.Use the figure above to answer the following questions.
a. Identify the curves labeled A and B.Identify the curve which contains both point Y and point Z.Identify the curve which contains both point V and point W.
b.What is the profit-maximizing quantity and what price will the monopolist charge?
c.What area represents total revenue at the profit-maximizing output level?
d.What area represents total cost at the profit-maximizing output level?
e.What area represents profit?
f.What is the profit per unit (average profit)at the profit-maximizing output level?
g.If this industry was organized as a perfectly competitive industry, what would be the profit-maximizing price and quantity?
h.What area represents the deadweight loss as a result of a monopoly?
Correct Answer:
Verified
View Answer
Unlock this answer now
Get Access to more Verified Answers free of charge
Q143: Relative to a perfectly competitive market, a
Q144: Figure 15-7 Q145: Compared to perfect competition, the consumer surplus Q146: Figure 15-9 Q147: A monopolist's demand curve is the same Q149: Why does a monopoly cause a deadweight Q150: Economic efficiency in a free market occurs Q151: Figure 15-9 Q152: Explain why the monopolist has no supply Q153: Figure 15-9 Unlock this Answer For Free Now! View this answer and more for free by performing one of the following actions Scan the QR code to install the App and get 2 free unlocks Unlock quizzes for free by uploading documents
![]()
![]()
![]()
![]()

