
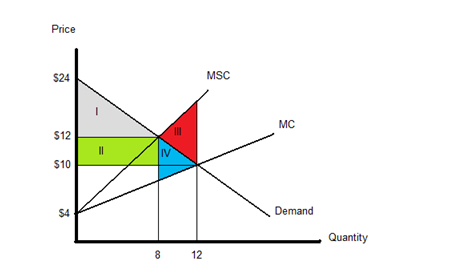
In the graph above, which area represents the size of the externality?
A) I
B) II
C) III
D) Iv
Correct Answer:
Verified
Q10: Which of the following statements is true
Q11: Use the following information to answer the
Q12: Which of the following are reasons for
Q13: Externalities occurred due to
A)A lack of property
Q14: Use the following information to answer the
Q15: Use the following information to answer the
Q16: The arguments against price competition in the
Q17: The private market cannot eliminate externalities when
A)Marginal
Q18: The demand curve for flu shots is
Q20: A "natural monopoly" is the result of
A)Government
Unlock this Answer For Free Now!
View this answer and more for free by performing one of the following actions

Scan the QR code to install the App and get 2 free unlocks

Unlock quizzes for free by uploading documents