Multiple Choice

Figure 2.1
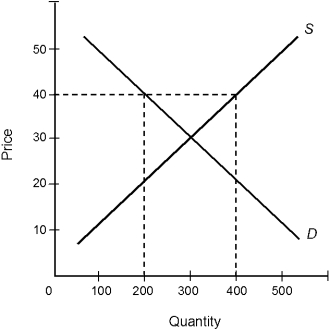
-Consider the market described by the demand and supply curves in Figure 2.1. Which of the following is true if the current market price is $40 per unit?
A) The quantity demanded is 400 units.
B) There is a shortage of 200 units.
C) The quantity sold is 200 units.
D) The quantity supplied is 200 units.
E) There is an excess demand of 200 units.
Correct Answer:
Verified
Related Questions

