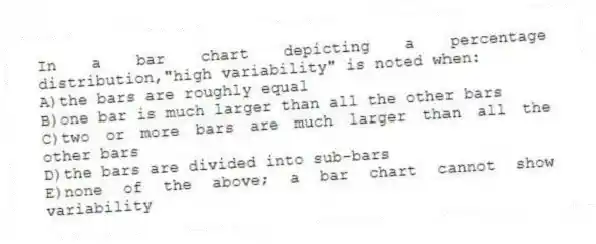
In a bar chart depicting a percentage distribution,"high variability" is noted when:
A) the bars are roughly equal
B) one bar is much larger than all the other bars
C) two or more bars are much larger than all the other bars
D) the bars are divided into sub-bars
E) none of the above; a bar chart cannot show variability
Correct Answer:
Verified
Q9: Computing the average number of dollars college
Q10: The expression of how similar respondents are
Q11: _ analysis is defined as describing the
Q12: Which of the following is appropriate when
Q13: In XL Data Analyst,if you want to
Q15: Which of the following is the best
Q16: American Express executives hypothesize that 40% of
Q17: What would you use to summarize a
Q18: Which of the following was NOT one
Q19: Describing the typical response is referred to
Unlock this Answer For Free Now!
View this answer and more for free by performing one of the following actions

Scan the QR code to install the App and get 2 free unlocks

Unlock quizzes for free by uploading documents