Figure 8-1
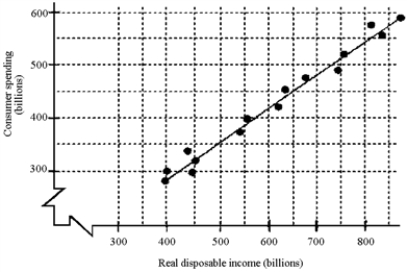
-Given the scatter diagram in Figure 8-1, how much will consumption decrease if the price level rises by 5 percent?
A) $50 billion
B) $100 billion
C) $200 billion
D) cannot be determined
Correct Answer:
Verified
Q82: Historical data depicted on a scatter diagram
Q85: The relationship between consumer spending and disposable
Q97: The difference between disposable income and consumption
Q98: If DI falls by $100 billion, and
Q99: The Marginal Propensity to Consume (MPC) is
Q100: If disposable income increases by $400 billion
Q100: "Men are disposed, as a rule, and
Q102: For each $1 of a tax cut,
Q102: If you fit a line through a
Q108: Assume that consumption in the United States
Unlock this Answer For Free Now!
View this answer and more for free by performing one of the following actions

Scan the QR code to install the App and get 2 free unlocks

Unlock quizzes for free by uploading documents