Use the figure below to answer the following questions.
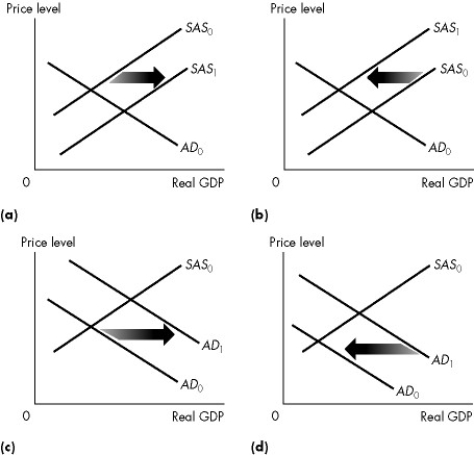
Figure 26.2.1
-Refer to Figure 26.2.1. Which graph illustrates what happens when expected future income increases?
A) (a) only
B) (b) only
C) (c) only
D) (d) only
E) Both (a) and (c)
Correct Answer:
Verified
Q48: Everything else remaining the same, an increase
Q49: Which of the following does not change
Q50: An inflationary gap is the amount by
Q51: The Canadian price level rises. What is
Q52: When the actual unemployment rate is equal
Q54: Canadian firms build new pipelines across the
Q55: Everything else remaining the same, an increase
Q56: Use the figure below to answer the
Q57: Which one of the following shifts the
Q58: Use the figure below to answer the
Unlock this Answer For Free Now!
View this answer and more for free by performing one of the following actions

Scan the QR code to install the App and get 2 free unlocks

Unlock quizzes for free by uploading documents