Multiple Choice
Figure 5-13
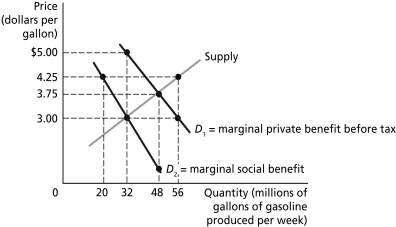
Figure 5-13 illustrates the market for gasoline before and after the government imposes a tax to bring about the efficient level of gasoline production.
-Refer to Figure 5-13.The amount of the gasoline tax is ________ per gallon.
A) $0.75
B) $1.25
C) $1.75
D) $2.00
Correct Answer:
Verified
Related Questions
Q142: Assume that production from an electric utility
Q162: Figure 5-11 Q163: Policies that mandate the installation of specific Q165: Economic incentives are designed to make individual Unlock this Answer For Free Now! View this answer and more for free by performing one of the following actions Scan the QR code to install the App and get 2 free unlocks Unlock quizzes for free by uploading documents
![]()

