Figure 27-2
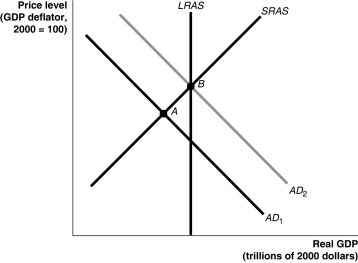
-Refer to Figure 27-2.In the graph above,suppose the economy is initially at point A.The movement of the economy to point B as shown in the graph illustrates the effect of which of the following policy actions by the Congress and the president?
A) a decrease in income taxes
B) a decrease in interest rates
C) a decrease in government purchases
D) an increase in the money supply
Correct Answer:
Verified
Q29: Figure 27-1 Q32: Figure 27-3 Q34: Figure 27-1 Q63: Tax increases on business income decrease aggregate Q67: Decreasing government spending _ the price level Q70: The problem causing most recessions is too Q73: Expansionary fiscal policy will Q74: A decrease in individual income taxes _ Q76: To combat a recession with discretionary fiscal Q82: An increase in government spending increases the Unlock this Answer For Free Now! View this answer and more for free by performing one of the following actions Scan the QR code to install the App and get 2 free unlocks Unlock quizzes for free by uploading documents
![]()
![]()
![]()
A)shift the aggregate demand

