Multiple Choice
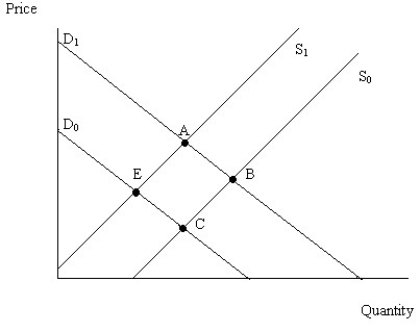
Figure 4.6
-Figure 4.6 illustrates a set of supply and demand curves for a product.When the market moves from point A to point B,there has been
A) an increase in supply and an increase in demand.
B) an increase in supply and an increase in quantity demanded.
C) an increase in quantity supplied and an increase in demand.
D) an increase in quantity supplied and an increase in quantity demanded.
Correct Answer:
Verified
Related Questions
Q229: When a government pays a company for
Q230: The market equilibrium price and quantity can

