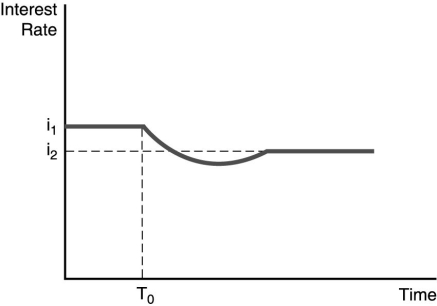
-The figure above illustrates the effect of an increased rate of money supply growth at time period T₀. From the figure, one can conclude that the ________.
A) Fisher effect is dominated by the liquidity effect and interest rates adjust slowly to changes in expected inflation
B) liquidity effect is dominated by the Fisher effect and interest rates adjust slowly to changes in expected inflation
C) liquidity effect is dominated by the Fisher effect and interest rates adjust quickly to changes in expected inflation
D) Fisher effect is smaller than the expected inflation effect and interest rates adjust quickly to changes in expected inflation
Correct Answer:
Verified
Q82: Q82: Q86: Q86: Economists recognize that interest rates are typically Q88: In the liquidity preference framework, demonstrate graphically Q100: Using the liquidity preference framework, what will Q132: If the liquidity effect is smaller than Q134: Using the liquidity preference framework,show what happens Q152: Holding many risky assets and thus reducing Q158: The _ the returns on two securities Unlock this Answer For Free Now! View this answer and more for free by performing one of the following actions Scan the QR code to install the App and get 2 free unlocks Unlock quizzes for free by uploading documents![]()
![]()
![]()

