Refer to the following graph to answer the questions that follow.
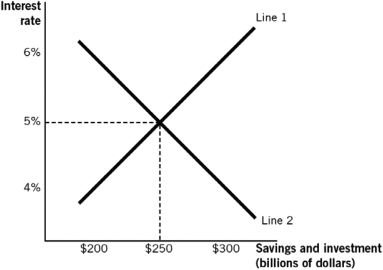
-In the figure,line 2 represents the ________ loanable funds,and at an interest rate of 6%,a ________ of loanable funds exists.
A) supply of; shortage
B) quantity demanded of; surplus
C) demand for; shortage
D) quantity supplied of; surplus
E) demand of; surplus
Correct Answer:
Verified
Q1: Savings represents:
A) the demand for loanable funds.
B)
Q4: Typically,savers in the loanable funds market are
Q5: Refer to the following graph to answer
Q5: The demand for loanable funds is
A) savings,because
Q6: Refer to the following graph to answer
Q7: Savings is the _ loanable funds and
Q9: Refer to the following graph to answer
Q10: The supply of loanable funds comes from
A)
Q11: Every dollar borrowed
A) represents a dollar leaving
Q15: The correct production timeline is
A) investment occurs,dollars
Unlock this Answer For Free Now!
View this answer and more for free by performing one of the following actions

Scan the QR code to install the App and get 2 free unlocks

Unlock quizzes for free by uploading documents