The figure below depicts the supply of U.S.dollars in the foreign currency exchange market.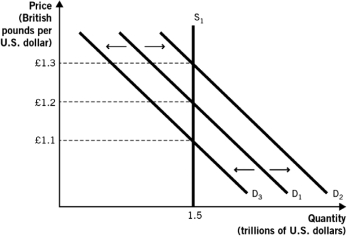
A shift from D₁ to D₃ in the above figure could have been caused by a(n) :
A) decrease in the exchange rate from £1.2/$1 to £1.1/$1.
B) increase in the exchange rate from £1.1/$1 to £1.2/$1.
C) increase in demand for U.S.assets relative to British assets.
D) increase in U.S.interest rates relative to British interest rates.
E) decrease in British consumers' demand for U.S.goods.
Correct Answer:
Verified
Q39: When demand for Canada's exports rises,
A) demand
Q44: The following two figures depict the demand
Q124: The following figure depicts the demand for
Q126: The following figure depicts the demand for
Q127: If interest rates in Canada increase relative
Q128: The following figure depicts the demand for
Q132: If interest rates in Australia decrease relative
Q134: The following two figures depict the demand
Q134: The following two figures depict the demand
Q151: What are some of the gains from
Unlock this Answer For Free Now!
View this answer and more for free by performing one of the following actions

Scan the QR code to install the App and get 2 free unlocks

Unlock quizzes for free by uploading documents