Exhibit 4-4 Supply and demand curves for good X
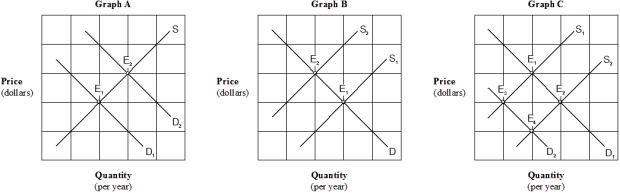
-An increase in buyers' income,assuming good X is a normal good,combined with an increase in the wage rate paid to workers producing good X would be represented by which of the following changes in equilibrium shown in Graph C of Exhibit 4-4?
A) E₁ to E₂.
B) E₁ to E₃.
C) E₃ to E₂
D) E₁ to E₃
E) E₄ to E₁.
Correct Answer:
Verified
Q21: Suppose prices for new homes have risen,
Q39: Exhibit 4-2 Supply and demand curves
Q40: Exhibit 4-3 Supply and demand curves
Q42: Exhibit 4-4 Supply and demand curves for
Q44: Exhibit 4-3 Supply and demand curves
Q45: Exhibit 4-4 Supply and demand curves for
Q47: Exhibit 4-4 Supply and demand curves for
Q55: If the cost of fertilizer rises, then
Q76: If market supply decreases and, simultaneously, market
Q175: Consider the market for grapes. An increase
Unlock this Answer For Free Now!
View this answer and more for free by performing one of the following actions

Scan the QR code to install the App and get 2 free unlocks

Unlock quizzes for free by uploading documents