Exhibit 13-2
The station manager of a local television station is interested in predicting the amount of television (in hours) that people will watch in the viewing area. The explanatory variables are: X1 age (in years), X2 education (highest level obtained, in years) and X3 family size (number of family members in household). The multiple regression output is shown below:
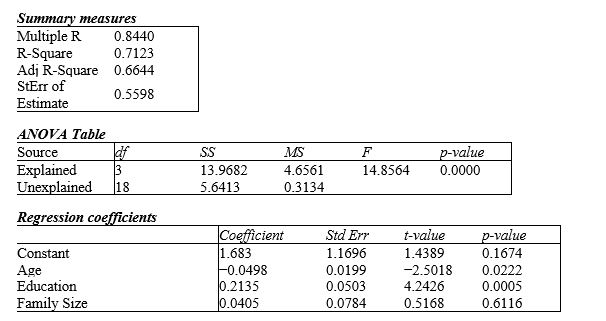
-Refer to Exhibit 13-2.Identify and interpret the percentage of variation explained (R2)for the model.
Correct Answer:
Verified
View Answer
Unlock this answer now
Get Access to more Verified Answers free of charge
Q4: The residual is defined as the difference
Q18: A model that uses temperature,season of the
Q19: In regression analysis,we can often use the
Q20: When using the moving average method,you must
Q21: Exhibit 13-2
The station manager of a local
Q23: Exhibit 13-3
The quarterly numbers of applications for
Q24: Exhibit 13-3
The quarterly numbers of applications for
Q25: Exhibit 13-3
The quarterly numbers of applications for
Q26: Exhibit 13-2
The station manager of a local
Q27: Exhibit 13-1
An express delivery service company
Unlock this Answer For Free Now!
View this answer and more for free by performing one of the following actions

Scan the QR code to install the App and get 2 free unlocks

Unlock quizzes for free by uploading documents