Multiple Choice
Figure 18-10
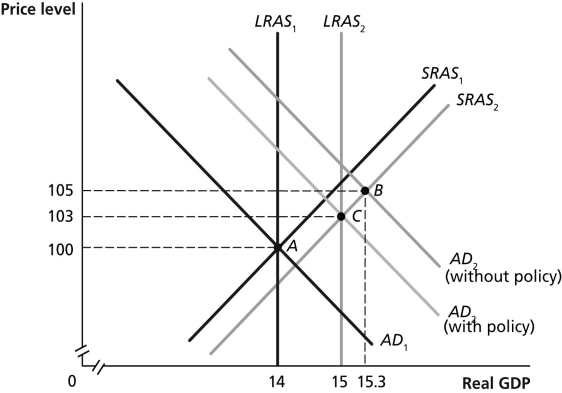
-Refer to Figure 18-10.In the graph above,suppose the economy in Year 1 is at point A and is expected in Year 2 to be at point B.Which of the following policies could Congress and the president use to move the economy to point C?
A) increase income taxes
B) increase government spending
C) buy Treasury bills
D) decrease the discount rate
Correct Answer:
Verified
Related Questions
Q102: What are the key differences between how
Q104: To complement actions by the Fed to

