Refer to the accompanying figure. An increase in demand is represented by a shift from: 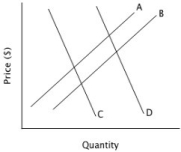
A) curve A to curve B.
B) curve B to curve A.
C) curve C to curve D.
D) curve D to curve C.
Correct Answer:
Verified
Q108: Refer to the accompanying figure, which shows
Q109: If the price of rubber (an input
Q110: Refer to the accompanying figure. An increase
Q111: Refer to the given table. Relative
Q112: Suppose that the technology used to manufacture
Q114: Which of the following would cause an
Q115: Refer to the accompanying figure, which shows
Q116: Refer to the accompanying figure. A decrease
Q117: What might cause a decrease in current
Q118: Refer to the accompanying figure, which shows
Unlock this Answer For Free Now!
View this answer and more for free by performing one of the following actions

Scan the QR code to install the App and get 2 free unlocks

Unlock quizzes for free by uploading documents