Refer to the accompanying figure. A decrease in demand is represented by a shift from: 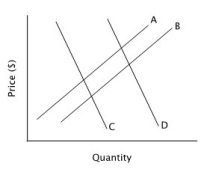
A) curve A to curve B.
B) curve B to curve A.
C) curve C to curve D.
D) curve D to curve C.
Correct Answer:
Verified
Q99: Which of the following is likely to
Q100: Suppose that a disease that affects people
Q101: As the price of flour (an input
Q102: Refer to the accompanying figure, which shows
Q103: Refer to the accompanying figure. Suppose the
Q105: Refer to the given table. Relative
Q106: Refer to the given table. Suppose
Q107: Refer to the accompanying figure. Suppose the
Q108: Refer to the accompanying figure, which shows
Q109: If the price of rubber (an input
Unlock this Answer For Free Now!
View this answer and more for free by performing one of the following actions

Scan the QR code to install the App and get 2 free unlocks

Unlock quizzes for free by uploading documents