The accompanying graph depicts demand. 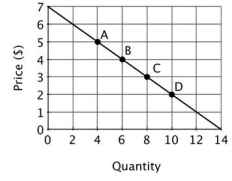 The slope of the demand curve (ignoring the negative sign) is:
A) 2.
B) 1.5.
C) 1.
D) 0.5.
Correct Answer:
Verified
Q55: Suppose that there is only one small
Q56: All else equal, the price elasticity of
Q57: The accompanying graph depicts demand. 
Q58: Suppose you learn that in 1,900, households
Q59: Assume the price of gasoline doubles tonight
Q61: At the midpoint of a straight-line demand
Q62: Refer to the accompanying graph. What is
Q63: Refer to the accompanying figure. At P
Q64: Refer to the accompanying figure. At P
Q65: As one moves down along a linear
Unlock this Answer For Free Now!
View this answer and more for free by performing one of the following actions

Scan the QR code to install the App and get 2 free unlocks

Unlock quizzes for free by uploading documents