The figure below depicts the short-run market equilibrium in a perfectly competitive market and the cost curves for a representative firm in that market. Assume that all firms in this market have identical cost curves. 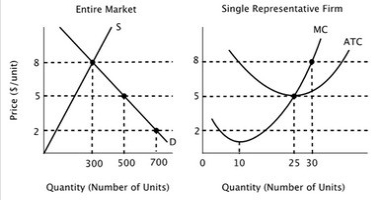 In the long run equilibrium in this market:
A) price will equal $5, and there will be 20 firms in the industry.
B) price will equal $5, and there will be 10 firms in the industry.
C) price will equal $8, and there will be 20 firms in the industry.
D) price will equal $5 and total output will equal 500 units, but there is not enough information to determine how many firms will be in the industry.
Correct Answer:
Verified
Q71: In a free market economy, the decisions
Q72: Barriers to entry are forces that:
A)limit consumers
Q73: The allocative function of price cannot operate
Q74: Assume that all firms in this industry
Q75: Assume that all firms in this industry
Q77: Free entry and exit of firms is
Q78: Some people have argued that the government
Q79: In a market with barriers to entry:
A)firms
Q80: If resources are misallocated in a perfectly
Q81: Unlike economic profit, economic rent:
A)can be less
Unlock this Answer For Free Now!
View this answer and more for free by performing one of the following actions

Scan the QR code to install the App and get 2 free unlocks

Unlock quizzes for free by uploading documents