The accompanying figure shows the demand curve, marginal revenue curve, marginal cost curve and average total cost curve for a monopolist. 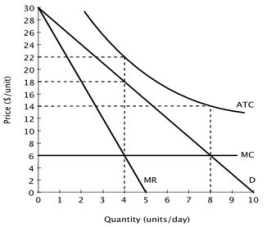 The socially optimal level of output is:
A) 4 units per day.
B) 5 units per day.
C) 8 units per day.
D) 10 units per day.
Correct Answer:
Verified
Q88: Suppose the accompanying table describes the
Q89: Suppose the accompanying table describes the
Q90: Suppose the accompanying figure shows the demand
Q91: Suppose the accompanying table describes the
Q92: The accompanying figure shows the demand curve,
Q94: The profit maximizing rule MR = MC
Q95: Suppose the accompanying figure shows the demand
Q96: The profit maximizing rule P = MC
Q97: Suppose the accompanying table describes the
Q98: Suppose the accompanying table describes the
Unlock this Answer For Free Now!
View this answer and more for free by performing one of the following actions

Scan the QR code to install the App and get 2 free unlocks

Unlock quizzes for free by uploading documents