This graph shows the marginal cost and marginal benefit associated with roadside litter clean up. Assume that the marginal benefit curve and marginal cost curve each have their usual slope. 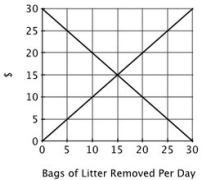 The socially optimal number of bags of litter removed from the roadside each day is:
A) 10.
B) 15.
C) 20.
D) 30.
Correct Answer:
Verified
Q66: Which one of the following government actions
Q67: In order to achieve the socially optimal
Q68: This graph shows the marginal cost and
Q69: This graph shows the marginal cost and
Q70: If the marginal cost of reducing pollution
Q72: Suppose Erie Textiles can dispose of its
Q73: Suppose that the EPA has proposed strict
Q74: The optimal quantity of a negative externality
Q75: This graph shows the marginal cost and
Q76: Suppose that the EPA has proposed strict
Unlock this Answer For Free Now!
View this answer and more for free by performing one of the following actions

Scan the QR code to install the App and get 2 free unlocks

Unlock quizzes for free by uploading documents