This graph shows the marginal cost and marginal benefit associated with roadside litter clean up. Assume that the marginal benefit curve and marginal cost curve each have their usual slope. 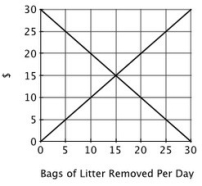 From the graph, one can infer that:
A) the marginal benefit of picking up the 10th bag of litter exceed the marginal cost.
B) the marginal cost of picking up the 10th bag of litter exceed the marginal benefit.
C) the marginal benefit of picking up the 20th bag of litter exceed the marginal cost.
D) the total benefit of having 30 bags removed is zero.
Correct Answer:
Verified
Q73: Suppose that the EPA has proposed strict
Q74: The optimal quantity of a negative externality
Q75: This graph shows the marginal cost and
Q76: Suppose that the EPA has proposed strict
Q77: If an activity generates a positive externality,
Q79: Suppose that the EPA has proposed strict
Q80: From the perspective of an externality, most
Q81: Refer to the figure below. At the
Q82: Refer to the figure below. At the
Q83: Refer to the figure below. If negotiation
Unlock this Answer For Free Now!
View this answer and more for free by performing one of the following actions

Scan the QR code to install the App and get 2 free unlocks

Unlock quizzes for free by uploading documents