The following graph shows the production possibilities curve for the economy with only two members, Silvia and Art. Silvia can produce either 50 pounds of beef or 2 computers per week, and Art can produce 100 pounds of beef or 1 computer per week. Both of them work 40 weeks per year. 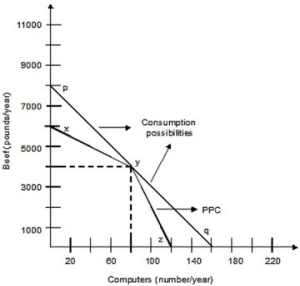 Silvia has a comparative advantage in producing ________, and Art has a comparative advantage in producing ________.
A) beef; beef
B) beef; computers
C) computers; beef
D) computers; computers
Correct Answer:
Verified
Q45: The following graph shows the production possibilities
Q46: The following graph shows the production possibilities
Q47: Sheila and Jim live in an island
Q48: The accompanying figure shows the annual production
Q49: If the United States consumption possibilities are
Q51: Sheila and Jim live in an island
Q52: The following graph shows the production possibilities
Q53: Sheila and Jim live in an island
Q54: Sheila and Jim live in an island
Q55: The accompanying figure shows the annual production
Unlock this Answer For Free Now!
View this answer and more for free by performing one of the following actions

Scan the QR code to install the App and get 2 free unlocks

Unlock quizzes for free by uploading documents