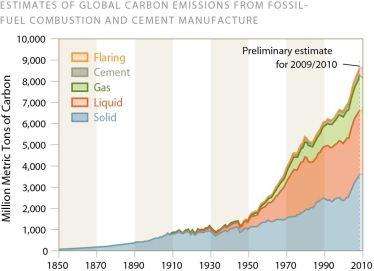
-The steep increase in global carbon emissions since 1950,shown in the figure above,most closely parallels the
A) rise in pH of the ocean over this same period.
B) size of the polar ice caps over this same period.
C) global surface temperatures over this same period.
D) increases in the speed of the Atlantic Ocean conveyor system over this same period.
Correct Answer:
Verified
Q72: Q73: If any component of the atmosphere causes Q74: Non-condensing GHGs are of greatest concern because Q75: Climatologists warn of a tipping point when Q76: In a cap-and-trade program, Q78: Additional increases in ocean levels beyond those Q79: Discussing the consequences of global climate change Q80: The most effective way to reduce GHG Q81: Which one of the following is not Q82: The precautionary principle,the polluter pays principle,and the![]()
A)companies that exceed emission
Unlock this Answer For Free Now!
View this answer and more for free by performing one of the following actions

Scan the QR code to install the App and get 2 free unlocks

Unlock quizzes for free by uploading documents