3.5 Market Effects of Changes in Supply
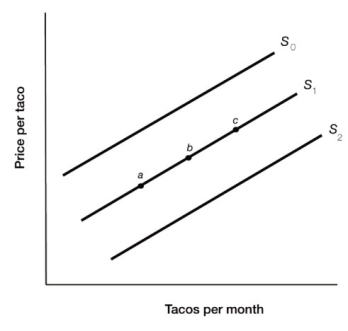 Figure 3.4
-Figure 3.4 illustrates the supply of tacos. A decrease in the supply of tacos is represented by a movement from
A) point a to point b.
B) point c to point b.
C) S₂ to S₁.
D) S₀ to S₁.
Correct Answer:
Verified
Q102: If there is an advancement in the
Q104: If a technological advance makes it possible
Q106: 3.5 Market Effects of Changes in Supply
Q108: Describe the changes in the variables that
Q109: If the number of automobile manufacturers decreases,
A)
Q111: 3.5 Market Effects of Changes in Supply
Q118: The price of iPhones has fallen dramatically.
Q119: Explain the difference between a change in
Q277: Draw a graph to illustrate the effect
Q279: Draw a graph to illustrate the effect
Unlock this Answer For Free Now!
View this answer and more for free by performing one of the following actions

Scan the QR code to install the App and get 2 free unlocks

Unlock quizzes for free by uploading documents