The figures given below show the demand (D) and supply (S) curves of labor in two different markets. Figure 15.3 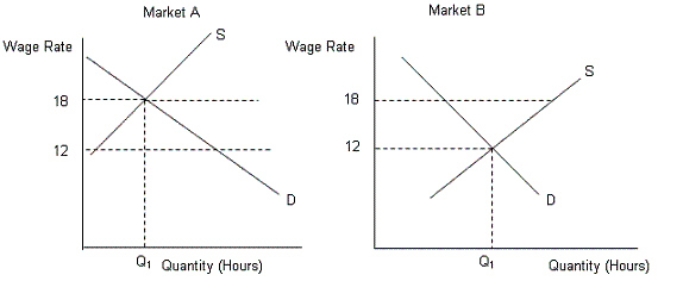
-From Figure 15.3,calculate the amount of the wage differential.
A) $6
B) $18
C) $2
D) $20
E) $15
Correct Answer:
Verified
Q20: As the wage rate increases,the quantity supplied
Q21: The figure given below shows the demand
Q23: The intention of a minimum wage is
Q24: Minimum wage legislation by the government would:
A)create
Q26: The U.S.government has time and again raised
Q27: Why has the inequality of income become
Q28: If the supply of skilled workers is
Q29: A college student's choice of a major
Q30: An individual is induced to change his/her
Q36: The figures given below show the demand
Unlock this Answer For Free Now!
View this answer and more for free by performing one of the following actions

Scan the QR code to install the App and get 2 free unlocks

Unlock quizzes for free by uploading documents