The figure given below shows cost curves of a firm. Figure: 7.2 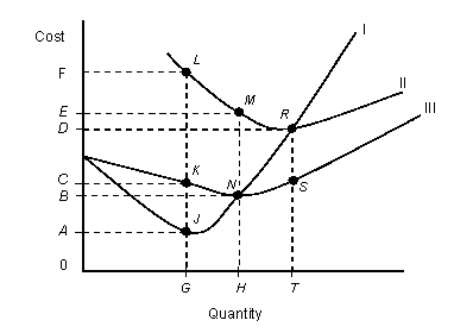
- In the figure,
|: Marginal cost curve
||: Average total cost curve
|||: Average variable cost curve
Refer to Figure 7.2.At an output level of H,average total cost is:
A) 0E.
B) BE.
C) area 0EMH.
D) 0B.
E) area 0BNH.
Correct Answer:
Verified
Q8: The below figure shows the various combinations
Q17: When average total cost is minimum,it is:
A)equal
Q19: If an average cost curve is U-shaped,then:
A)costs
Q20: Average total cost is calculated by dividing:
A)the
Q21: Assume that one laborer produces 6 units
Q23: Suppose that for 20 bicycles,the total fixed
Q24: The following table shows the cost of
Q25: The table below shows the total cost
Q26: The following table shows the cost of
Q27: The figure given below shows cost curves
Unlock this Answer For Free Now!
View this answer and more for free by performing one of the following actions

Scan the QR code to install the App and get 2 free unlocks

Unlock quizzes for free by uploading documents