The figure given below shows cost curves of a firm. Figure: 7.2 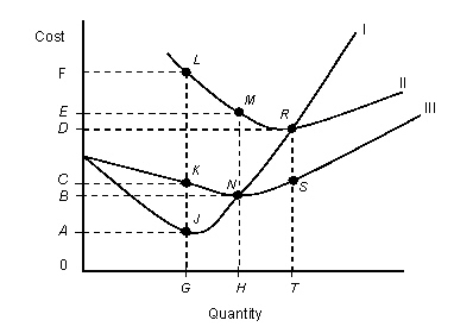
- In the figure,
|: Marginal cost curve
||: Average total cost curve
|||: Average variable cost curve
Refer to Figure 7.2.At an output level of G:
A) both average total cost and average variable cost are falling.
B) average fixed cost is equal to the distance JK.
C) average variable cost exceeds marginal cost by the amount LJ.
D) average total cost exceeds marginal cost by the amount KJ.
E) total cost is equal to the area 0AJG.
Correct Answer:
Verified
Q24: The following table shows the cost of
Q25: The table below shows the total cost
Q26: The following table shows the cost of
Q27: The figure given below shows cost curves
Q28: The figure given below shows the average
Q30: The figure given below shows the average
Q31: The following table shows the cost of
Q32: Which of the following is not correct?
A)If
Q33: The figure given below shows cost curves
Q34: The following table shows the cost of
Unlock this Answer For Free Now!
View this answer and more for free by performing one of the following actions

Scan the QR code to install the App and get 2 free unlocks

Unlock quizzes for free by uploading documents